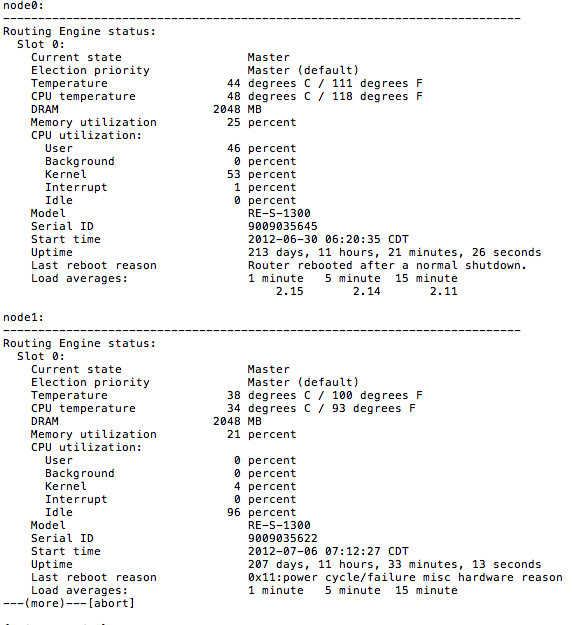
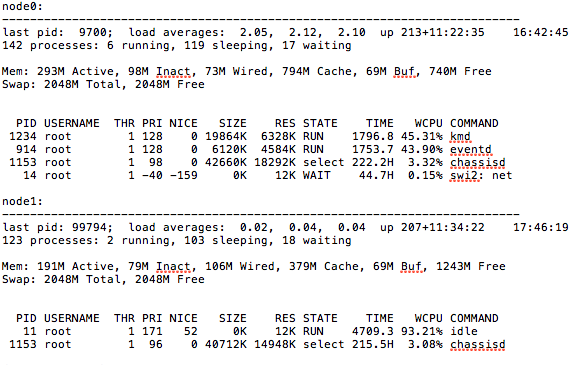
Recently we encountered a very strange behavior on an SRX 5800 cluster. The cluster, which is in active/active mode, started dropping OSPF adjacencies to it’s neighboring routing equipment, in this case, Juniper MX480 and Brocade/Foundry MLX8. Strange behavior indeed, since for us, these had been rock solid for around 2 years and we’d never seen this odd behavior before. Honestly, we started looking at the routers first since this was something the SRX has never done before. After noticing that it was actually link dropping and not just OSPF having issues, we dug deeper into logs (as an aside, this is an excellent reason to centrally syslog everything. And I do mean everything). To our surprise and dismay, it was actually the SRX node0 actually rebooting all of its interface line cards. “show chassis routing-engine” showed that User was taking up a very significant amount of CPU. This is a problem.
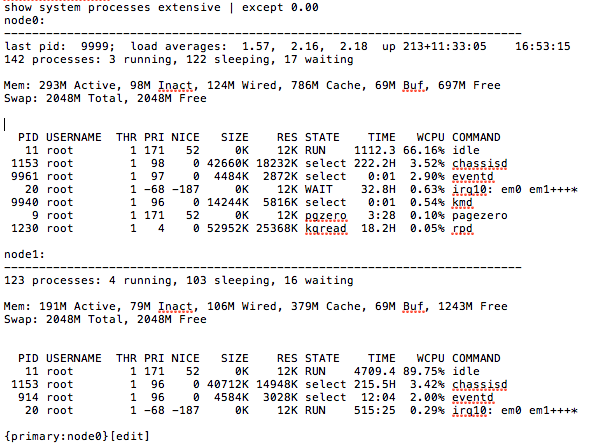
As you can probably guess, this isn’t a good state. So, in order to drill down what was causing User to be so abnormally high, we had to do a little sleuthing. Running “show system processes extensive | except 0.00” will display any process that isn’t zero. From here it was pretty obvious what was eating the CPU.
“kmd” and “eventd”, as you can see, are chewing up an abnormally high amount of CPU. First things first, make sure no traceoptions are on. “show conf | display set | match traceoptions” We had some on so we disabled them. Next, lets make sure we know what “kid” and “eventd” are. KMD is the key management process. It provides IP Security (IPSec) authentication services for encryption Physical Interface Cards (PICs). eventd is the event policy process. It performs configured actions in response to events on a routing platform that trigger system log messages. It’s all starting to add up. I’ll bet there are a LOT of IPsec messeges in the log. “show log messages” confirms this. There are a LOT of KMD messages, which is likely causing events to eat even more resources to generate them. Jan 29 12:02:53 fw1 (FPC Slot 11, PIC Slot 0) init: kmd1 (PID 176) started _Jan 29 12:02:53 _fw1 (FPC Slot 11, PIC Slot 0) init: kmd2 (PID 177) started _Jan 29 12:02:53 _fw1 (FPC Slot 11, PIC Slot 0) init: kmd3 (PID 178) started _Jan 29 12:02:53 _fw1 (FPC Slot 11, PIC Slot 0) init: kmd4 (PID 179) started _Jan 29 12:02:54 _fw1 (FPC Slot 11, PIC Slot 1) init: kmd1 (PID 176) started _Jan 29 12:02:55 _fw1 (FPC Slot 11, PIC Slot 1) init: kmd2 (PID 177) started _Jan 29 12:02:55 _fw1 (FPC Slot 11, PIC Slot 1) init: kmd3 (PID 178) started _Jan 29 12:02:55 _fw1 (FPC Slot 11, PIC Slot 1) init: kmd4 (PID 180) started _Jan 29 12:03:13 _fw1 (FPC Slot 4, PIC Slot 0) init: kmd1 (PID 176) started _Jan 29 12:03:13 _fw1 (FPC Slot 4, PIC Slot 0) init: kmd2 (PID 177) started _Jan 29 12:03:13 _fw1 (FPC Slot 4, PIC Slot 0) init: kmd3 (PID 178) started _Jan 29 12:03:13 _fw1 (FPC Slot 4, PIC Slot 0) init: kmd4 (PID 179) started _Jan 29 12:03:14 _fw1 (FPC Slot 5, PIC Slot 0) init: kmd1 (PID 176) started _Jan 29 12:03:14 _fw1 (FPC Slot 5, PIC Slot 0) init: kmd2 (PID 177) started _Jan 29 12:03:14 _fw1 (FPC Slot 5, PIC Slot 0) init: kmd3 (PID 178) started _Jan 29 12:03:15 _fw1 (FPC Slot 5, PIC Slot 0) init: kmd4 (PID 179) started Check the security log to verify “show log kmed” Dec 27 05:58:05 KMD_INTERNAL_ERROR: iked_re_ipc_err_handler: status: 1: usp_ipc_client_open: failed to connect to the server after 5 retries Dec 27 05:58:05 KMD_INTERNAL_ERROR: iked_re_send_msg_to_spu: failed to connect to iked_spu on SPU - Connection refused. Dec 27 05:58:05 KMD_INTERNAL_ERROR: iked_re_ipc_err_handler: status: 1: usp_ipc_client_open: failed to connect to the server after 5 retries Dec 27 05:58:05 KMD_INTERNAL_ERROR: iked_re_send_msg_to_spu: failed to connect to iked_spu on SPU - Connection refused. Dec 27 05:58:05 KMD_INTERNAL_ERROR: iked_re_ipc_err_handler: status: 1: usp_ipc_client_open: failed to connect to the server after 5 retries Dec 27 05:58:05 KMD_INTERNAL_ERROR: iked_re_send_msg_to_spu: failed to connect to iked_spu on SPU - Connection refused. Dec 27 05:58:05 KMD_INTERNAL_ERROR: iked_re_ipc_err_handler: status: 1: usp_ipc_client_open: failed to connect to the server after 5 retries Dec 27 05:58:05 KMD_INTERNAL_ERROR: iked_re_send_msg_to_spu: failed to connect to iked_spu on SPU - Connection refused. Dec 27 05:58:05 KMD_INTERNAL_ERROR: iked_re_ipc_err_handler: status: 1: usp_ipc_client_open: failed to connect to the server after 5 retries Yeah, looks suspicious. Lets restart ipsec-key-management and see if that helps. “restart ipsec-key-management”. Note: If this does not work, you may have to drop to the shell and kill it like a unix process. “start shell” “kill -9 kmd” Idle process should now be back to normal.
CPU’s were at a “normal” state in our environment has the idle process near 90% (+/-). In the future this will be monitored so that this problem does sneak up on us. Now, the right way to remedy this is to disable those services if you don’t need them. If you do not plan to terminate VPN tunnels, there is no reason to run the services (on by default) to do so. We opted to both disable and do a more inclusive loopback filter which seems to have taken care of the problem. Take aways from this is multi faceted. The SRX is a weird beast. It’s JunOS, so the inclination is to treat it like a router, but it ’s not. It’s a firewall. And an IPS. And a router. I’m planning to write up an “SRX command cheat sheet” for this because it’s got enough different pieces and commands that I believe it warrants one. Secondly, there are a lot of intricacies in monitoring these devices since they arent just routers. I’m hoping to come up with a best practice for monitoring an SRX cluster in a carrier type environment as well. I’m sure they’ll both be living documents.


Share this post
Twitter
Google+
Facebook
Reddit
LinkedIn
StumbleUpon
Pinterest
Email