There is no shortage of network telemetry data that can be collected, recorded, graphed, and stored for cross reference and triage. Not one to be underestimated, latency at a can be incredibly powerful when leveraged for baseline and deviation notification. As I have eluded to in the past, there are many tools in this space. I have written about a few of them in detail and touched on others in passing. Regardless of the tool, the data is powerful and the instrumentation they provide will only serve to make your network more robust and easier to work on. One tool that is particularly easy to set up and utilize is smokeping. From the authors site: SmokePing keeps track of your network latency:
- Best of breed latency visualisation.
- Interactive graph explorer.
- Wide range of latency measurement plugins.
- Master/Slave System for distributed measurement.
- Highly configurable alerting system.
- Live Latency Charts with the most ‘interesting’ graphs.
- Free and OpenSource Software written in Perl written by Tobi Oetiker, the creator of MRTG and RRDtool
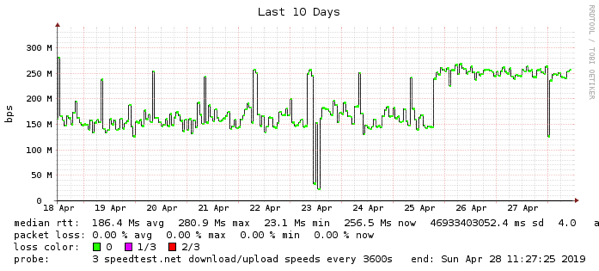
 Comcast SpeedTest.net graph for home network Now, you may be asking _“why do I need to track latency?_”, well, the data is incredibly powerful and can be indicators of anything from a failing optic to a network compromise. This is especially useful in small to medium sized ISPs (and especially WISPs), where cost of software and operational overhead is at a premium, and customer satisfaction is the currency that is dealt. In fact, I was able to use smokeqping to help diagnose a functional denial of service of a commonly deployed cable CPE as detailed here. I can’t emphasize enough how useful long term trend data is. Smokeping can be used to monitor more than just ping RTT, it supports a myriad of plugins allowing for application latency of protocols such as DNS queries, http get, ssh daemon response, speed test results, the list of plugins - or as smokeping calls them, probes - goes on and can be found here. Where this is particularly useful is in simulating customer experience. As with most things in life, perspective is paramount. To address this, smokeping can also be deployed as a distributed model. Deploying it with installations more local to a customer or in a far flung site, say on a raspberry pi, located in remote POP sides or pedestal locations will provide a closer perspective to what the customer actually sees. In the past I have deployed remote raspberry pi devices in an actual FTTH pedestal connected to an ONT to provide the exact customer point of view and it provided a wealth of information I would not otherwise be able to see. There are a myriad of different instal guides for Smokeping, my recommended starting point is by Gerd Naschenweng and can be found here. It provides a docker instance but also has a very good set of configuration files to build examples from. Don’t discount latency data - it’s a powerful set of information for any working network. For anyone interested in seeing a working smokeping installation, mine is public and available to view. It provides a few things such as DNS latency, RTT for v4 and v6, RTT for ZeroTier hosts and RIPE ATLAS probes, etc. It’s a powerful toolkit. My public cloud instance is hosted at prgmr.com and can be found here.
Share this post
Twitter
Google+
Facebook
Reddit
LinkedIn
StumbleUpon
Pinterest
Email