Debugging Brocade MLX/XMR ip_rx CPU issues
I recently had the need to debug a run away ip_rx process on an older Brocade MLX. For anyone that has had to do any type of low level debugging on the Brocade (Foundry) platform, you know that there many somewhat deep level diagnostics that are possible. The debug (like cisco debug) is a bit lacking, but the dm, LP and MP commands are very useful (and a tad scary). Regardless, I’ve had to utilize them a lot in the last few years so my aversion to using them has been pretty much completely callused over. So, when there was notification of CPU issues (common on the platform in environments I’m familiar with), I started poking around. First off, thediagnostic documents are your friend. They’re fairly deep and wide in scope. After looking at the cpu, it was pretty clear what the culprit was. rtr4-2#sh cpu-utilization | e 0 … Usage average for all tasks in the last 1 seconds …
Name us/sec %
idle 68435 11
ip_rx 724619 72
ospf 36942 3
snmp 82753 8
I needed to get info on that ip_rx process. Google actually wasn’t terribly helpful, so I dig out what I wanted, except for the process for breaking into the management module monitor mode. The golden ticket ended up being “ctrl+y m enter” from the console. That drops you into the OS mode or management module monitor mode that looks like this.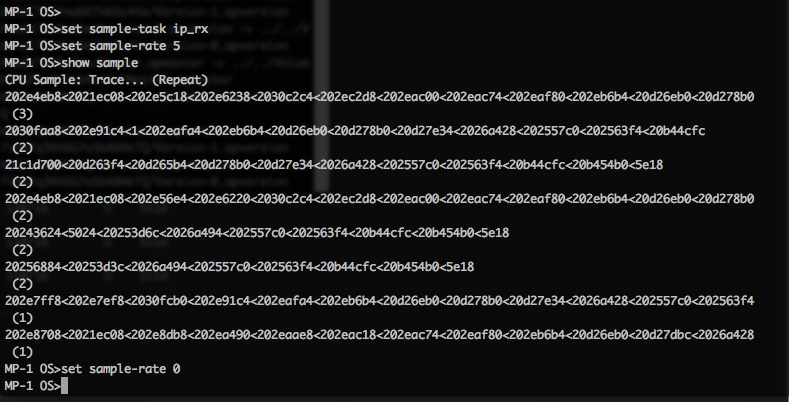
Basically this is what I gathered for the Brocade TAC.
MP-1 OS>set sample-task ip_rx
MP-1 OS>set sample-rate 5
MP-1 OS>show sample
CPU Sample: Trace... (Repeat)
202e4eb8<2021ec08<202e5c18<202e6238<2030c2c4<202ec2d8<202eac00<202eac74
 .....
MP-1 OS>set sample-rate 0
MP-1 OS>exit
Back to Application console...
Setting the task to sample is pretty simple:set sample-task
set sample-rate
to show the sample, simply
show sample
and then to disable the sampling
set sample-rate 0
This can be used to gather all kinds of disgnostic data for seemingly any running process for the brocade TAC to decipher.