Monitoring VMware ESXi with SNMP and Cacti
VMWare is a powerful tool, and monitoring is a critical service. How does one monitor such an integral piece of infrastructure, and what do they monitor it with? There are powerful commercial ways of monitoring VMware , however, for those with existing SNMP based systems in place, specifically cacti , there are options. To that end, I’ll set aside my strong distaste for SNMP [yet again], because those are for a larger, less useful series of posts.
Luckily for those of us that need it there exists in that vast wilderness we call the internet, a user contributed cacti template for monitoring basic functionality with SNMP and cacti and it is available here , and with the full thread being worth a read here . Since VMWare ESXi doesn’t have SNMP enabled (or really exposed from what I can tell), you have to do some CLI jockeying to make it work. Full disclosure, I’m not a vmware expert by any stretch of the imagination, but I have been hacking at it for a few years because it is low overhead to use comparatively speaking, offers a free version for my lab, makes a nice contrast to my KVM system and is widely deployed, so I want to understand it. Your mileage may vary with what I’ve got here.
Enabling ssh is beyond the scope of this post but details can be found here . It’s fairly straightforward. Details of enabling SNMP for vmware 5.5 can be found here , essentially one simply needs to run the following commands from within an ssh session:
esxcli  system snmp set --communities <community>
esxcli system snmp set --port 161
esxcli system snmp set --enable true
Getting the cacti scripts in place is a little more involved, but it’s still pretty simple. Using the importer just add the new template.  Once that is imported you’ll need to move some scripts into place within the cacti system as below (adjust your paths as needed; I moved them directly from my workstation into place)
scp ss_esxi_vhosts.php netmon:/var/lib/cacti/scripts/
scp cacte_esxi_template/resource/snmp_queries/* netmon:/usr/share/cacti/resource/snmp_queries/
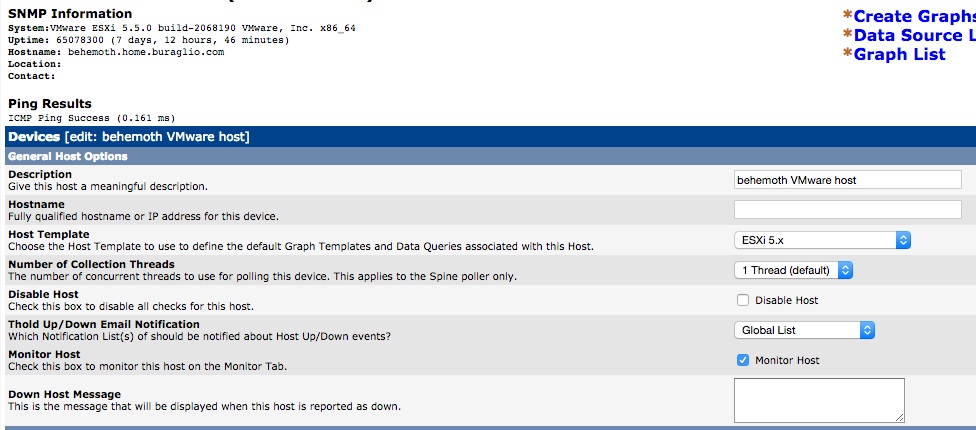
 Then adjust the template being used for your ESXi server or add it as a new host if it was not there already. The new template should show up in the list.
Once complete the cacti server should start graphing and checking uptime, etc. IF it does not, make sure the scripts are in place and have the correct permissions. It’s also useful (although not required) to add the additional parameters to the host.
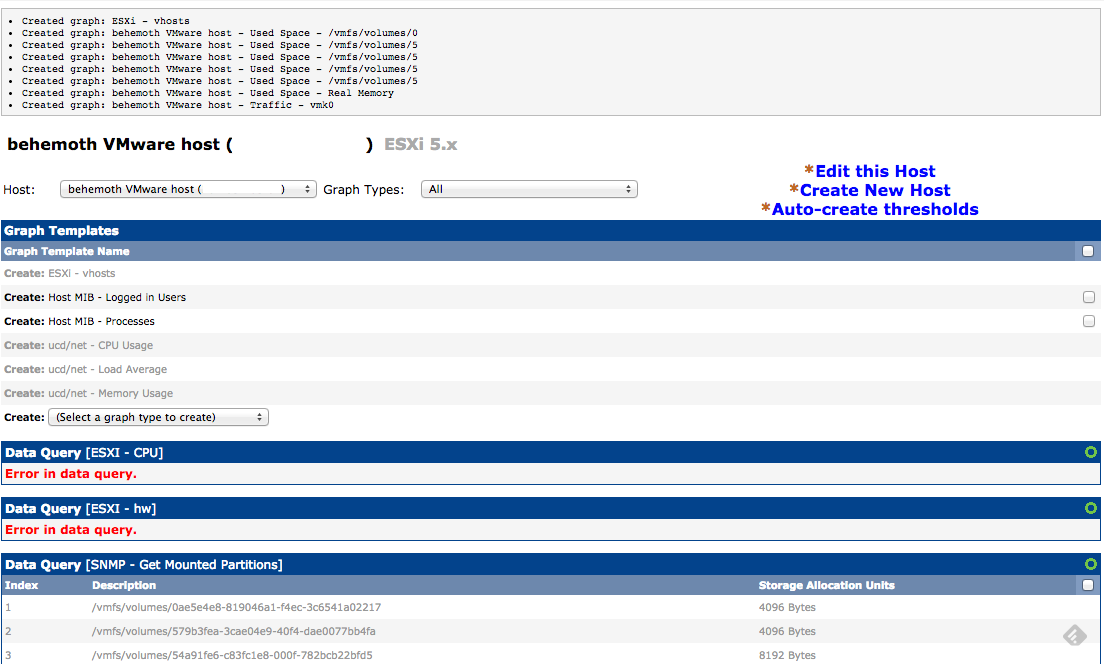
Once complete, the cacti system should be able to baseline (and alert if so desited, using thresholds) on any of the newly added variables, including number of VMs, number of VMs using vmware tools, number of VMs running, disk space, processes, network traffic, etc.

I have yet to be able to get successful CPU graphs, but I suspect it is user error on my part and I’ve not investigated yet. Overall, I’d call it a pretty bigwin for anyone that has an existing cacti installation and wants to include their vmware system(s). It should also be said that the readme that accompanies the template is relatively useful.