Building a host telemetry solution using Tailscale
An often overlooked dimension of data collection is flow data from hosts. This is not a new concept, there have been tools built for this for a very long time, but in many cases, and especially over the last 8-10 years, many system engineers have gravitated toward tooling like grafana and prometheus . While these are fine tools and if done well provide an excellent view of host health, they aren’t really a full picture of host behavior. Because this is generally expected to be handled by the network, it’s frequently overlooked. However, because many environments do not implement sflow on their layer 2 devices, it can be beneficial to export this data from the hosts themselves.
For this recipe, we’ll need three ingredients.
Host Systems and flow generation
Let’s suppose you have some cloud systems that there is a requirement or desire to have network flow analytics. Similar to an internal environment, tools exist to export flow data (both Netflow and sFlow), but they are exported as unencrypted datagrams that are likely undesirable to have open and viewable across a public network. Even if the network is using private network interconnects (PNI) , it’s a good idea to encrypt the transport of this information.
There are two options here, hsflowd and pmacct. both work, both are available in apt sources for ubuntu, but pmacctd is more flexible.
hsflowd docs Example hsflowd config
sflow {
     agent = tailscale0
     polling = 10
     sampling.1G = 100
     sampling.10G = 1024
     sampling.40G = 1024
     collector { ip=100.68.194.88 udpport=6343 }
     # collector {ip=fd7a:115c:a1e0::e601:c258 udpport=6343 }
     #pcap { dev = ens3 }
     nflog { group = 5 probability = 0.0025 }
}
/etc/pmacct/pmacctd.conf
daemonize: true
pidfile: /var/run/pmacctd.pid
syslog: daemon
  plugins: sfprobe[any]
  sfprobe_receiver: 100.68.194.88:6343
  sfprobe_agentip: 100.65.156.88
  #sfprobe_receiver: [fd7a:115c:a1e0::e601:c258]:6343
  #sfprobe_agentip: fd7a:115c:a1e0::5501:9c58
  aggregate: src_host,dst_host,in_iface,out_iface,src_port,dst_port,proto
  pcap_ifindex: map
  pcap_interfaces_map: /etc/pmacct/interfaces.map
  pcap_interface_wait: true
  sfprobe_agentsubid: 1402
  sampling_rate: 100
  snaplen: 128
/etc/pmacct/interfaces.map
  ifindex=1 ifname=lo direction=in
  ifindex=1 ifname=lo direction=out
  ifindex=3 ifname=ens3 direction=in
  ifindex=3 ifname=ens3 direction=out
Collection system
There are a number of ways to do this, manually configured discreet wireguard tunnels, ZeroTier , or as used here, Tailscale tunnels. If someone was so inclined they could even do it with IPsec, although I can’t imagine trying to manage that with any amount of sanity left intact. Tailscale is very easy to set up, and has a very generous entry level free tier with a very polished web management dashboard and exceptionally good documentation.
Akvorado requires hosts to support SNMP polling, so we’ll need to install snmpd on each host and restrict the access. SNMPv3 is preferable, but I had some issues getting that to work with akvorado, although it should be supported .
example /etc/snmp/snmpd.conf
agentAddress udp6:[fd7a:115c:a1e0::5501:9c58]161
agentAddress udp:100.65.156.88:161

#snmpv3 config
createUser snmpv3user-changeme MD5 snmpv3MD5-changeme AES snmpv3encAES-changeme
rwuser snmpv3user-changeme priv 1.3.6.1.2.1
#snmp2 config
rocommunity hostSNMPv2-changeme default
rocommunity6 hostSNMPv2-changeme default
rouser authOnlyUser
#owner
sysLocation Somewhereville, IL, US
sysContact Snake Plisskin <iheardhewasdead@escapefrom.ny>
Flow Collector
For a flow collector, Akvorado is a great choice both for feature completeness, ease of use (i.e. great docs), and cost (FOSS). Akvorado has a very good docker implementation with a simple and straightforward quick-start guide .
Following the quick start guide and using docker, the akvrado system should be fairly easy to make work. Two important details are the metadata configuration in /opt/akvorado/config/inlet.yaml. Look for the metadata configuration and add your SNMP configuration
Example snmp inlet.yaml
metadata:
  workers: 10
  provider:
    type: snmp
    communities:
      ::/0: hostSNMPv2-changeme # for ipv6
      0.0.0.0/0: hostSNMPv2-changeme # for legacy IP
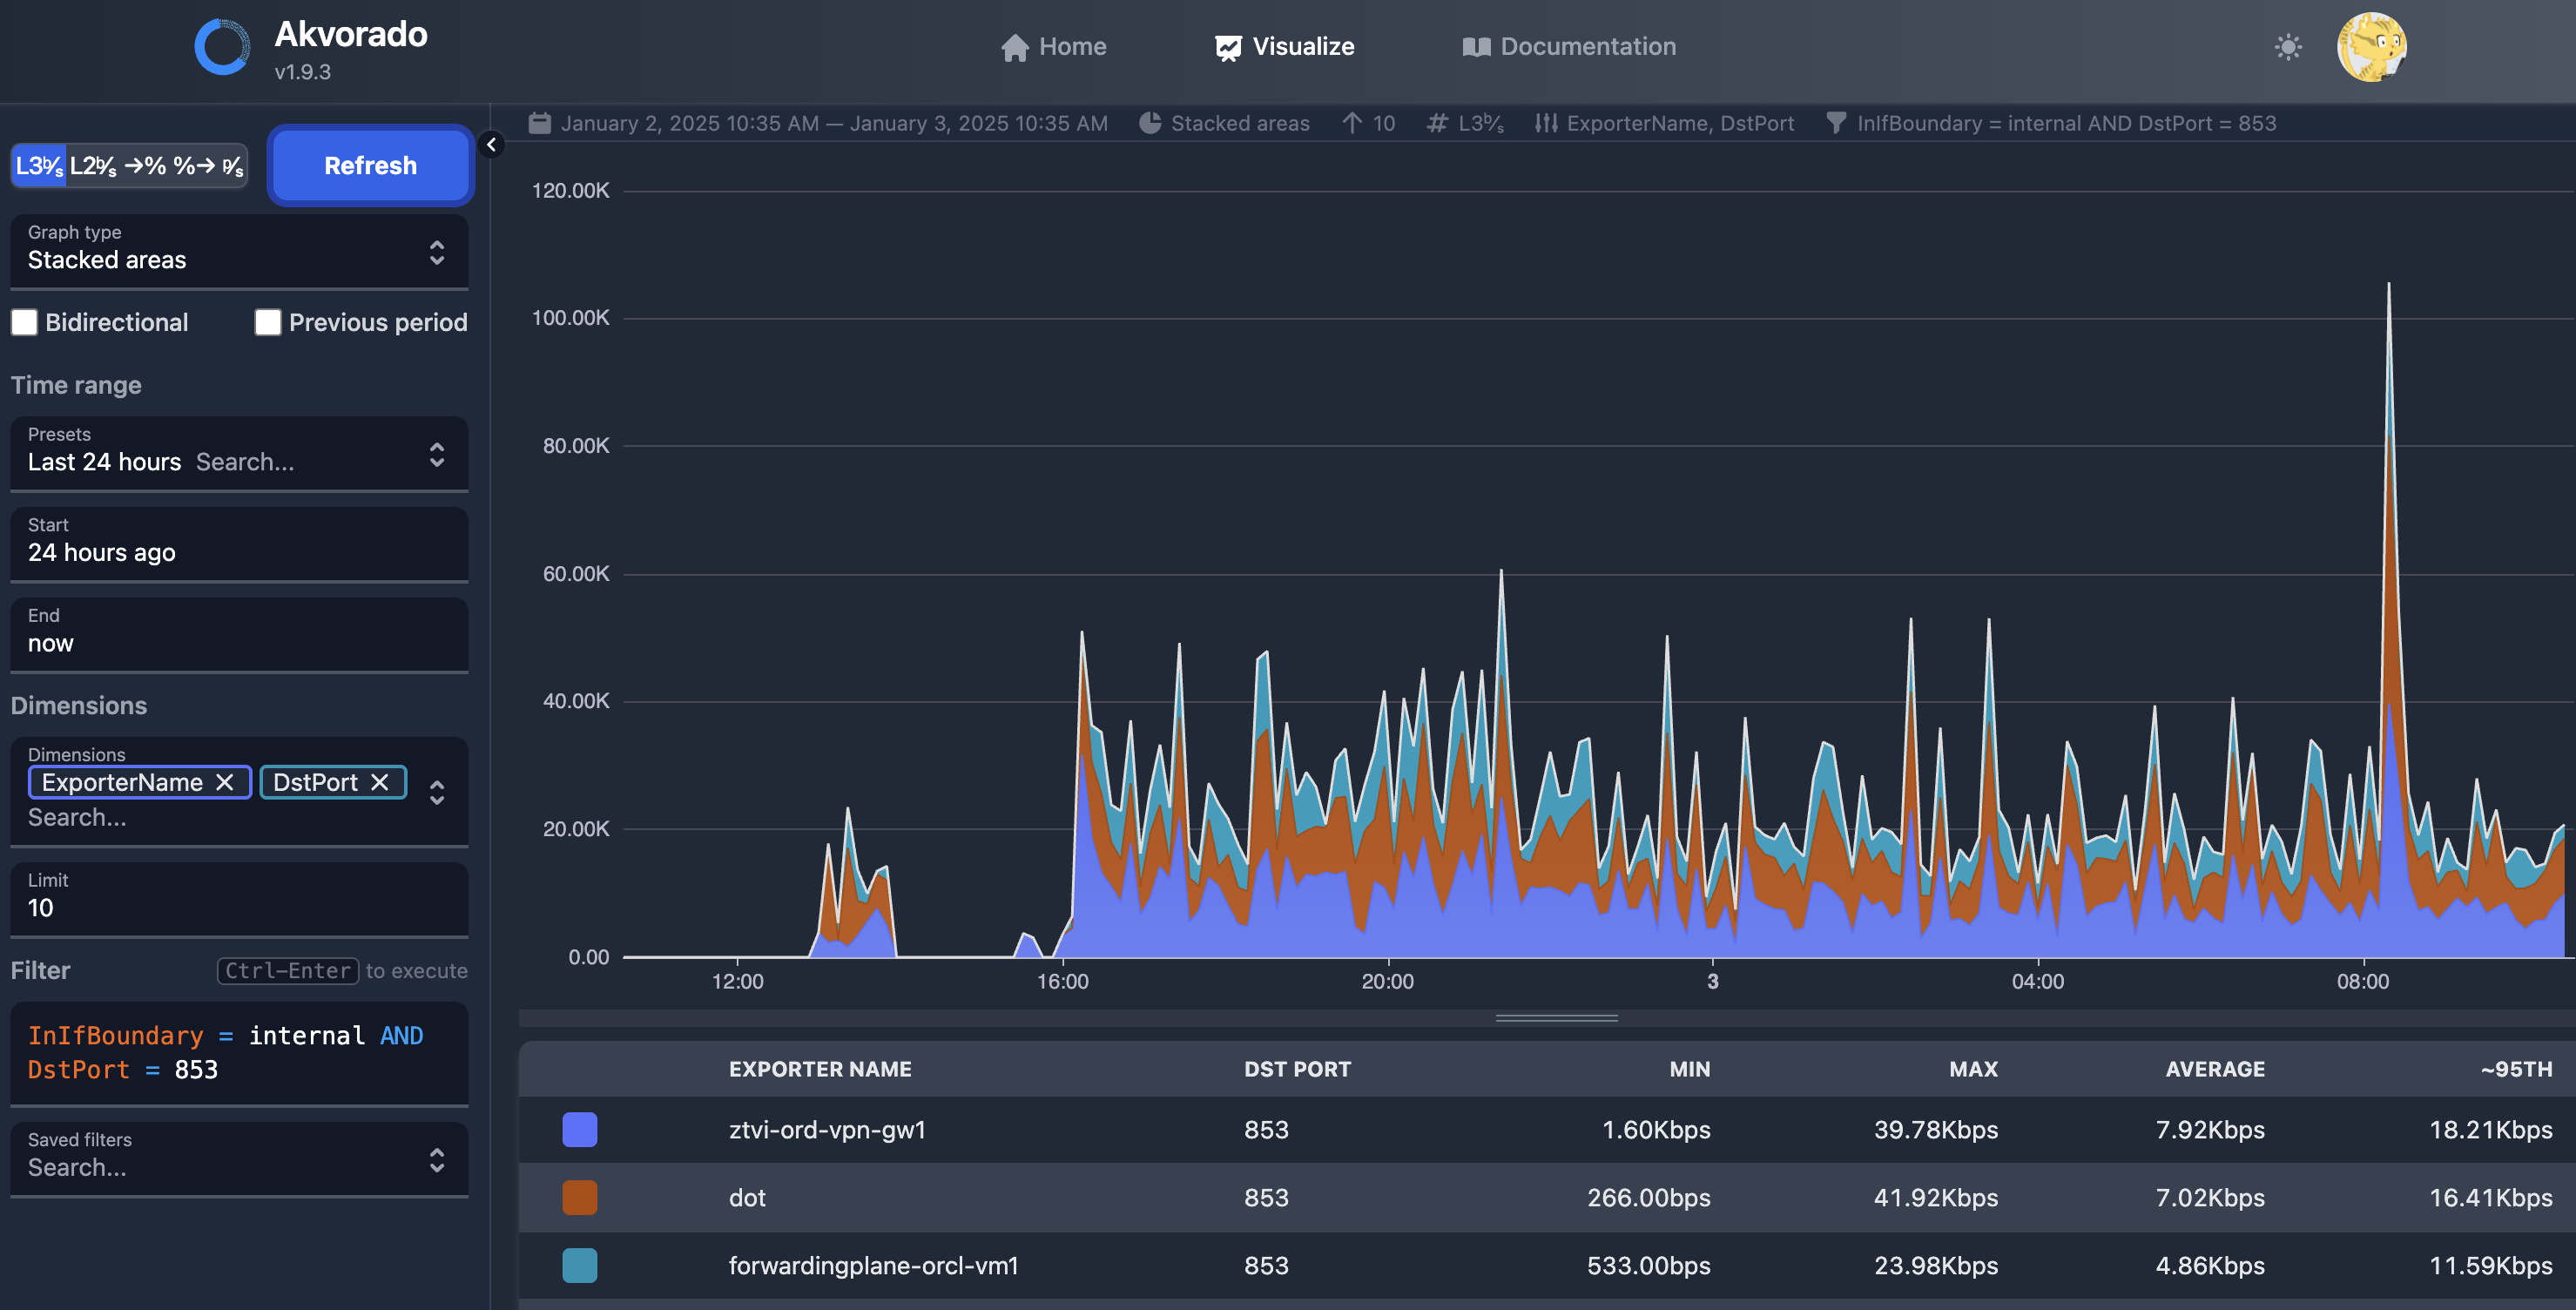
The end result is a reasonably good view of what hosts generate on their network interfaces, which can be used for any number of things from capacity planning to intrusion detection.

If there is a clear theme here, it is good documentation. Each of these components has terrific, easy to follow documentation.
My preference is to use IPv6 for everything, and at face value every component supports IPv6. However, there were some issues with SNMP polling with Akvorado over IPv6 which still needs investigated. It should be noted, however, that the linux hosts in question do not have a public IPv4 address, in fact, the akvorado collector as well as several of the hosts running pmacctd have no IPv4 either (they do have CLAT and a NAT64 system configured). Tailscale works without the presence of legacy IP, and provides it inside the tunnel unless explicitly disabled, which allowed for the use of legacy IP over the tunnel to compensate for the SNMP polling problems.